Train your team to focus on what matters and give an effective performance review
Before you jump into finding a KPI for your team, it’s important to know your responsibility and the ‘why’. Are you responsible for helping your company to generate more sales, marketing growth, SEO ranking? or are you responsible for helping your developers grow, improve tech stack, improve the codebase, reduce bugs, deploy more features? Or is do you need to balance both the company and the developers? I’d recommend finding your answers to these questions first.
In long term, It is unmotivating to keep track of your KPIs if you have too many Indicators. So, try to start with a few and setup proper system/tool for measuring it.
If your team runs in a 100% Agile environment you can always use standard Agile metrics like Team Velocity, Lead time, Cycle time, and many more…
But for this article I will focus on KPIs below that any team can adapt:
- Largest Contentful Paint (LCP)
- Page Rendering
- Error Rate
- Code Coverage
- Knowledge Sharing (Written Documentation, Blog Posts)
If possible, it’s always good to have one platform to collect all these data. Tools like newrelic.com , elastic.co and https://sentry.io.
How to Measure
As I mentioned earlier that having one place to measure all of your metrics is always a good idea. For this article let’s focus on measuring these KPIs in Newrelic.
Please follow this article to install Newrelic on your web app or website. Then create a dashboard called Dev KPIs.

Largest Contentful Paint (LCP)
The Largest Contentful Paint (LCP) metric reports the render time of the largest image or text block visible within the viewport, relative to when the page first started loading.
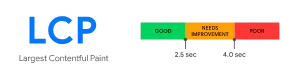
- web.dev
The latest version of the New Relic Browser agent script (v1167) captures LCP out of the box and takes into account a few intricacies of how this metric is reported by a browser.
Add a new chart to your dashboard called LCP and use this query to get data for the last 7 days.
FROM PageViewTiming SELECT percentile(largestContentfulPaint, 90), percentile(firstContentfulPaint, 90) TIMESERIES SINCE 30 DAYS AGO
Page Rendering
Whether you are working on a customer-facing app or an internal app, it’s important to have a fast enough app. But how do you know if your app is fast enough?
Measuring the Page Rendering weekly or biweekly is a great way to find out if your latest deployment really made a difference in your app performance. Your SEO team will appreciate the metrics breakdown too.
How page rendering was calculated?
In the browser, the time to display the HTML, run the inline JavaScript, and load images. Measured by the browser’s Load event.
You can use this query to get data in your Newrelic dashboard:
SELECT histogram(duration) FROM PageViewError Rate
Tools like Newrelic and Sentry help you to find browser + server errors as fast as possible so developers can patch them as quickly as possible.
You can use this query to get data in your Newrelic dashboard:
SELECT filter(count(*), where `error.message` is not null)*100 / filter(count(*), where duration is not null) from Transaction, TransactionError where appId = {your_app_id}Code Coverage
If you are working in an app that has 100% code coverage then you are one of the lucky ones. Congrats. In reality, most of us have to touch legacy codebases. Either way, it’s never too late to start writing tests.
Code coverage determines how much of your source code executes when it is being tested.
Unfortunately, Newrelic does not have a feature to record code coverage but you can send a custom event with the deployment notification.
Example with rest API:
curl -X POST 'https://insights-collector.newrelic.com/v1/YOUR_ACCOUNT_ID/123456/events' \
     -H 'X-Insert-Key: YOUR_INSIGHTS_INSERT_KEY' \
     -H 'Content-Type: application/json' \
     -d \
'{
	"eventType": "deployment",
	"appId": "1234",
	"appName": "App Name",
	"revision": "123456",
	"changelog": "Changes",
	"description": "60% coverage",
	"user": "Username"
}'
You can use this query to get data in your Newrelic dashboard:
SELECT * FROM deployment SINCE 1 week agoKnowledge Sharing (Written Documentation, Blog Posts)
This is more an individual KPI than for the whole team. It can be different in each project and company to find the right measurement for this.
If you are using a tool like Esdoc it has a great feature to generate the coverage of the documentations.
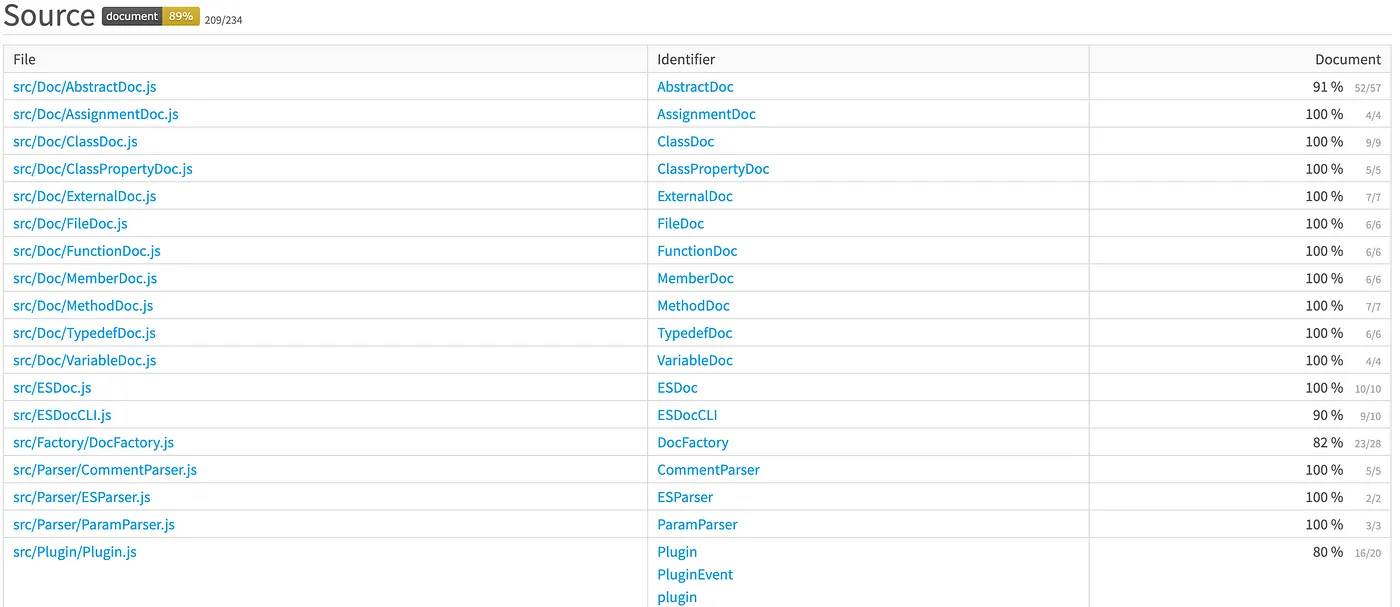
You can use the same workaround as Code Coverage to push these data to Newrelic.